| Table of Contents |
|---|
All the reports are available in the Reports section of Release Board:
...
Reports for Versions
Version Burnup
...
Chart
...
| Info | ||
|---|---|---|
|
...
Reports for Versions
Version Burnup Chart
...
Only applicable for Fix Versions as we can't yet track history for Virtual Versions. |
Version burnup report helps you to monitor version scope and development progress over time. It also allows spotting expected or unexpected scope changes and version progress trend.
Report configuration
User can choose any version in the board using version selector:
...
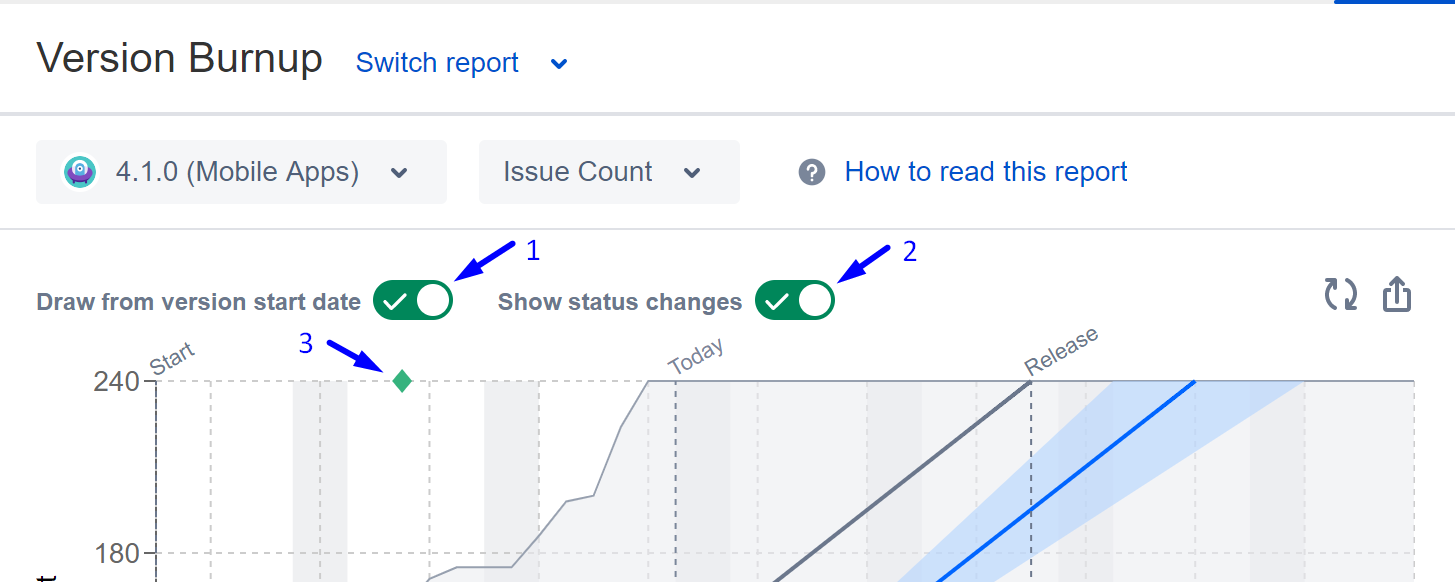
Draw version from the start date. If the option is enabled, the report is drawn from the version start date. Otherwise, from the date when the first item was added into the version.
Info The option is not available if version start date is empty.
Report content
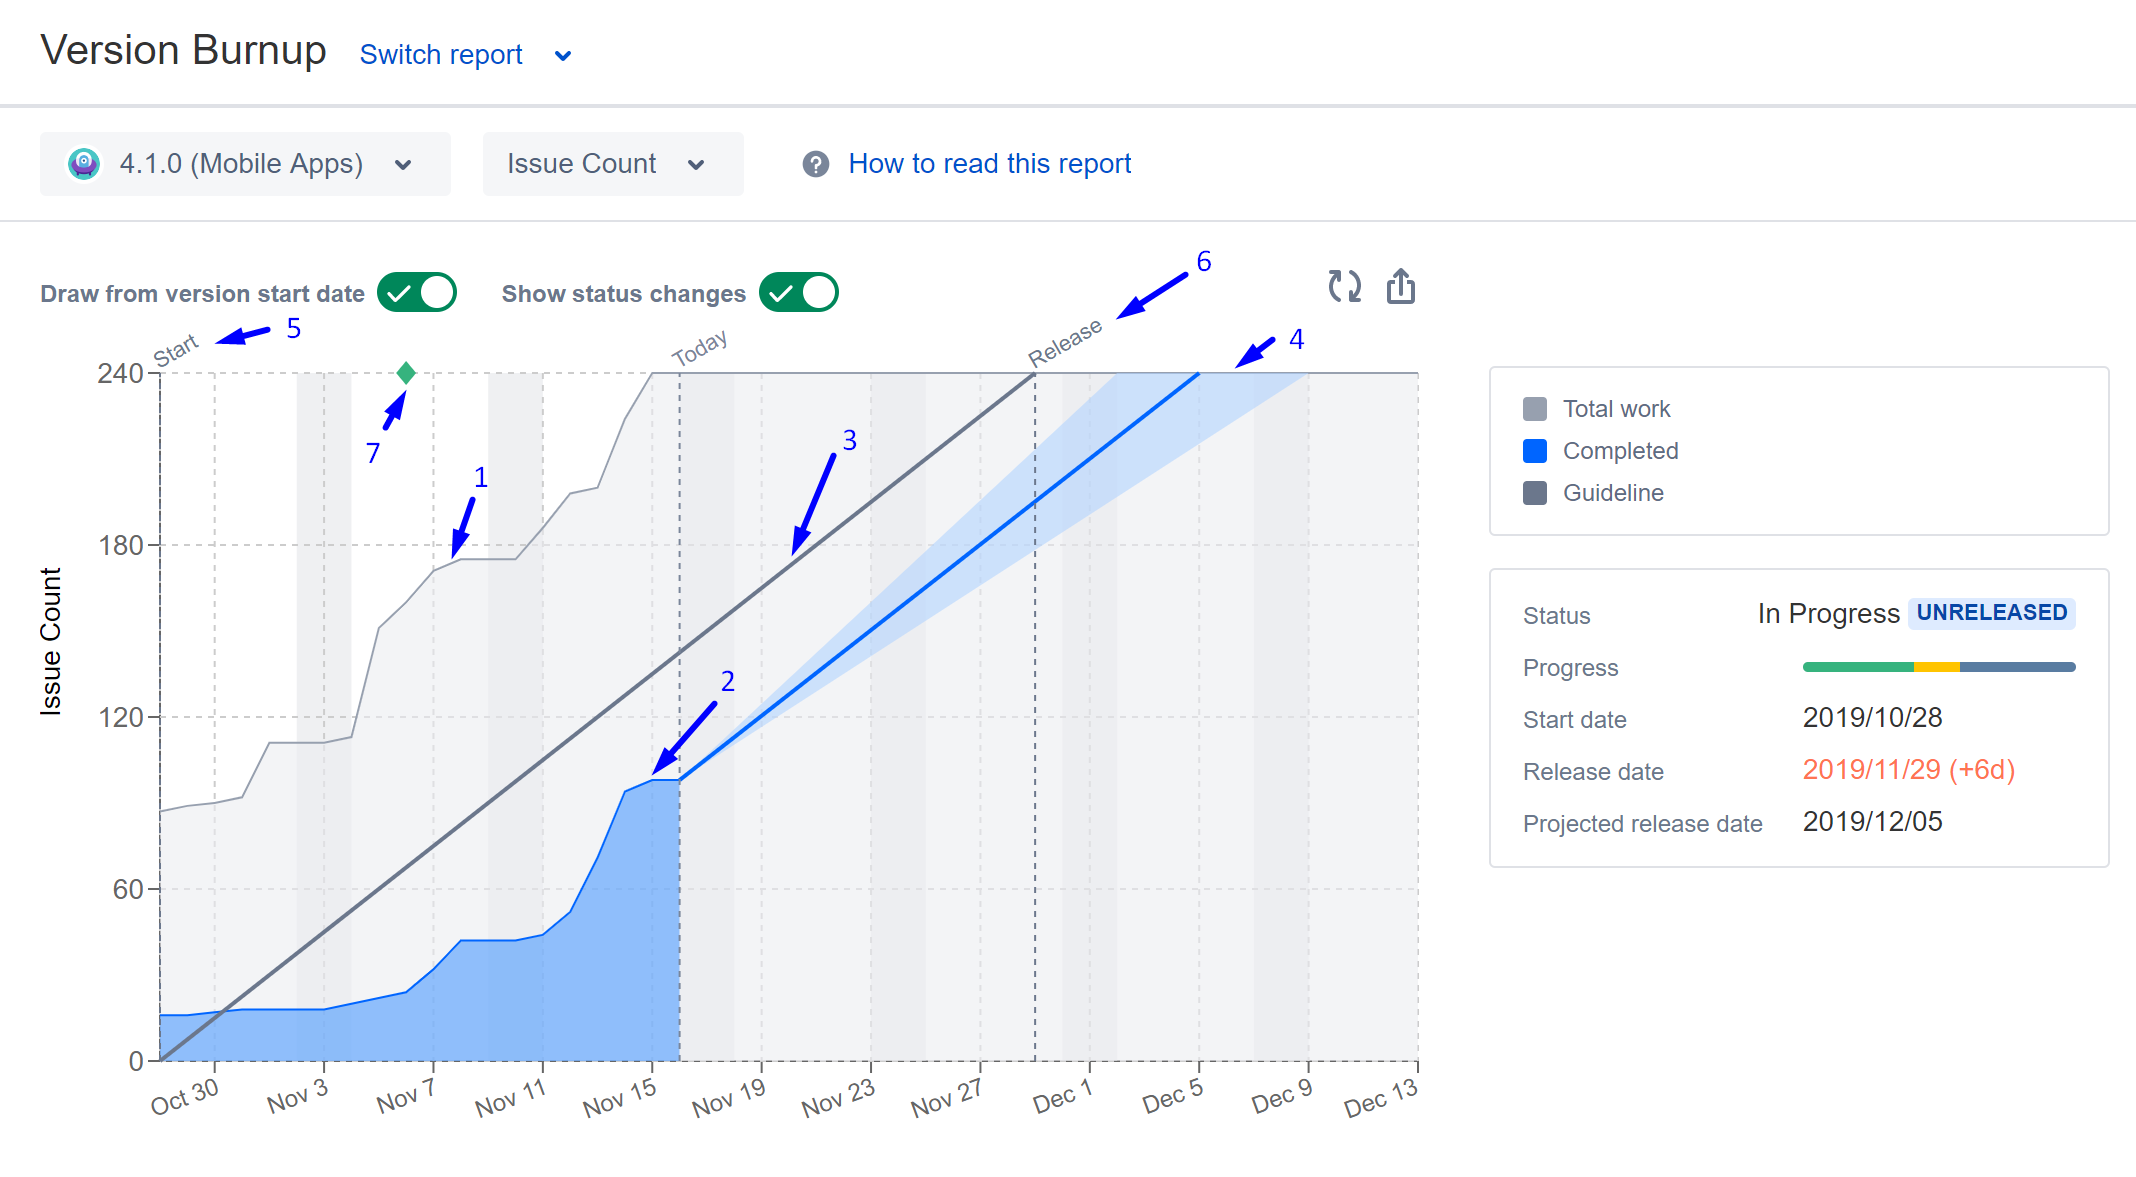
- Total scope of the version calculated on a daily base in selected units
- Done scope of the version
Guideline. Shows ideal burnup rate in order to complete version in time.
Info Guideline is only available if Start and Release dates are specified.
Version and release forecast. Draw optimistic, realistic and pessimistic guidelines based on the projected release date. Please read more details on how the projected release date calculated in FAQ
Info The forecast guideline will be drowned if the projected release date is calculated.
- Start date. Indicates version start date
- Release date. Indicates version release date
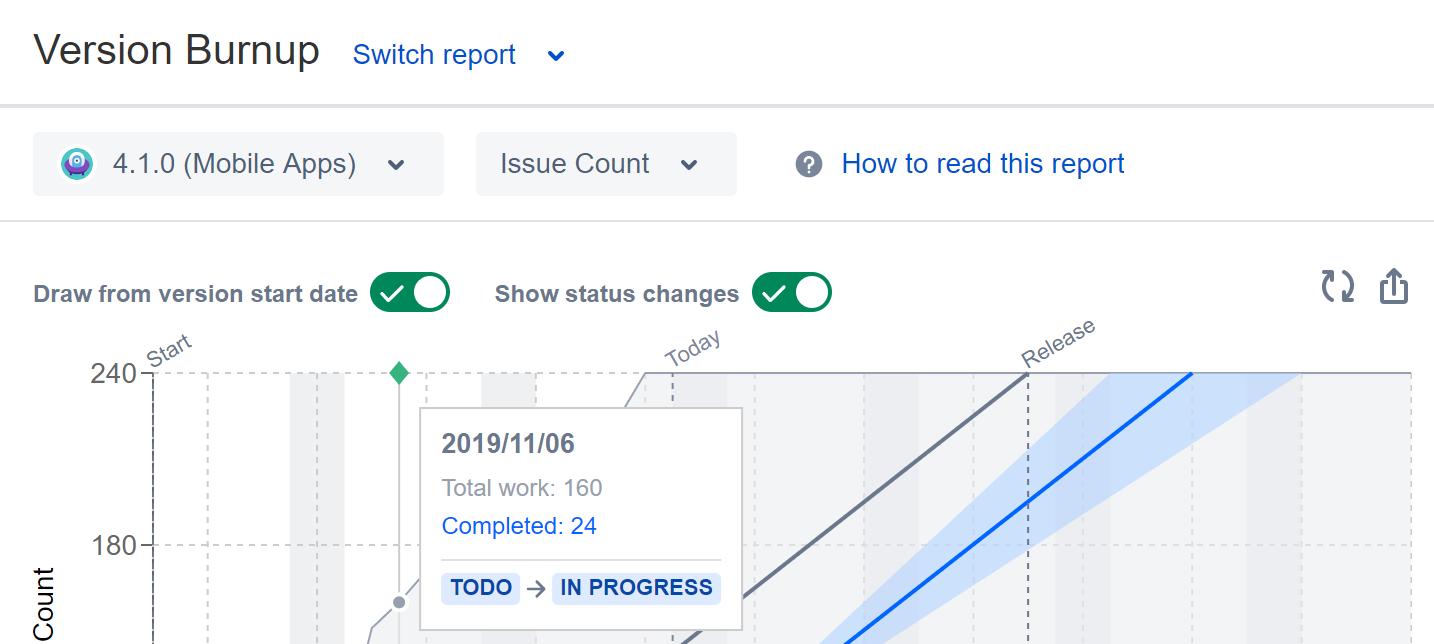
- Version status change. Indicates when the version was moved from one column to another one. The details are available on mouse-over.
Export to CSV
Total scope and amount of done items could be exported in CSV format using ![]() button.
button.
...
| Code Block |
|---|
"Date","Total","Completed" "2019/10/28","87","16" |
Version Trends Report
| Info | ||
|---|---|---|
| ||
Only applicable for Fix Versions as we can't yet track history for Virtual Versions. |
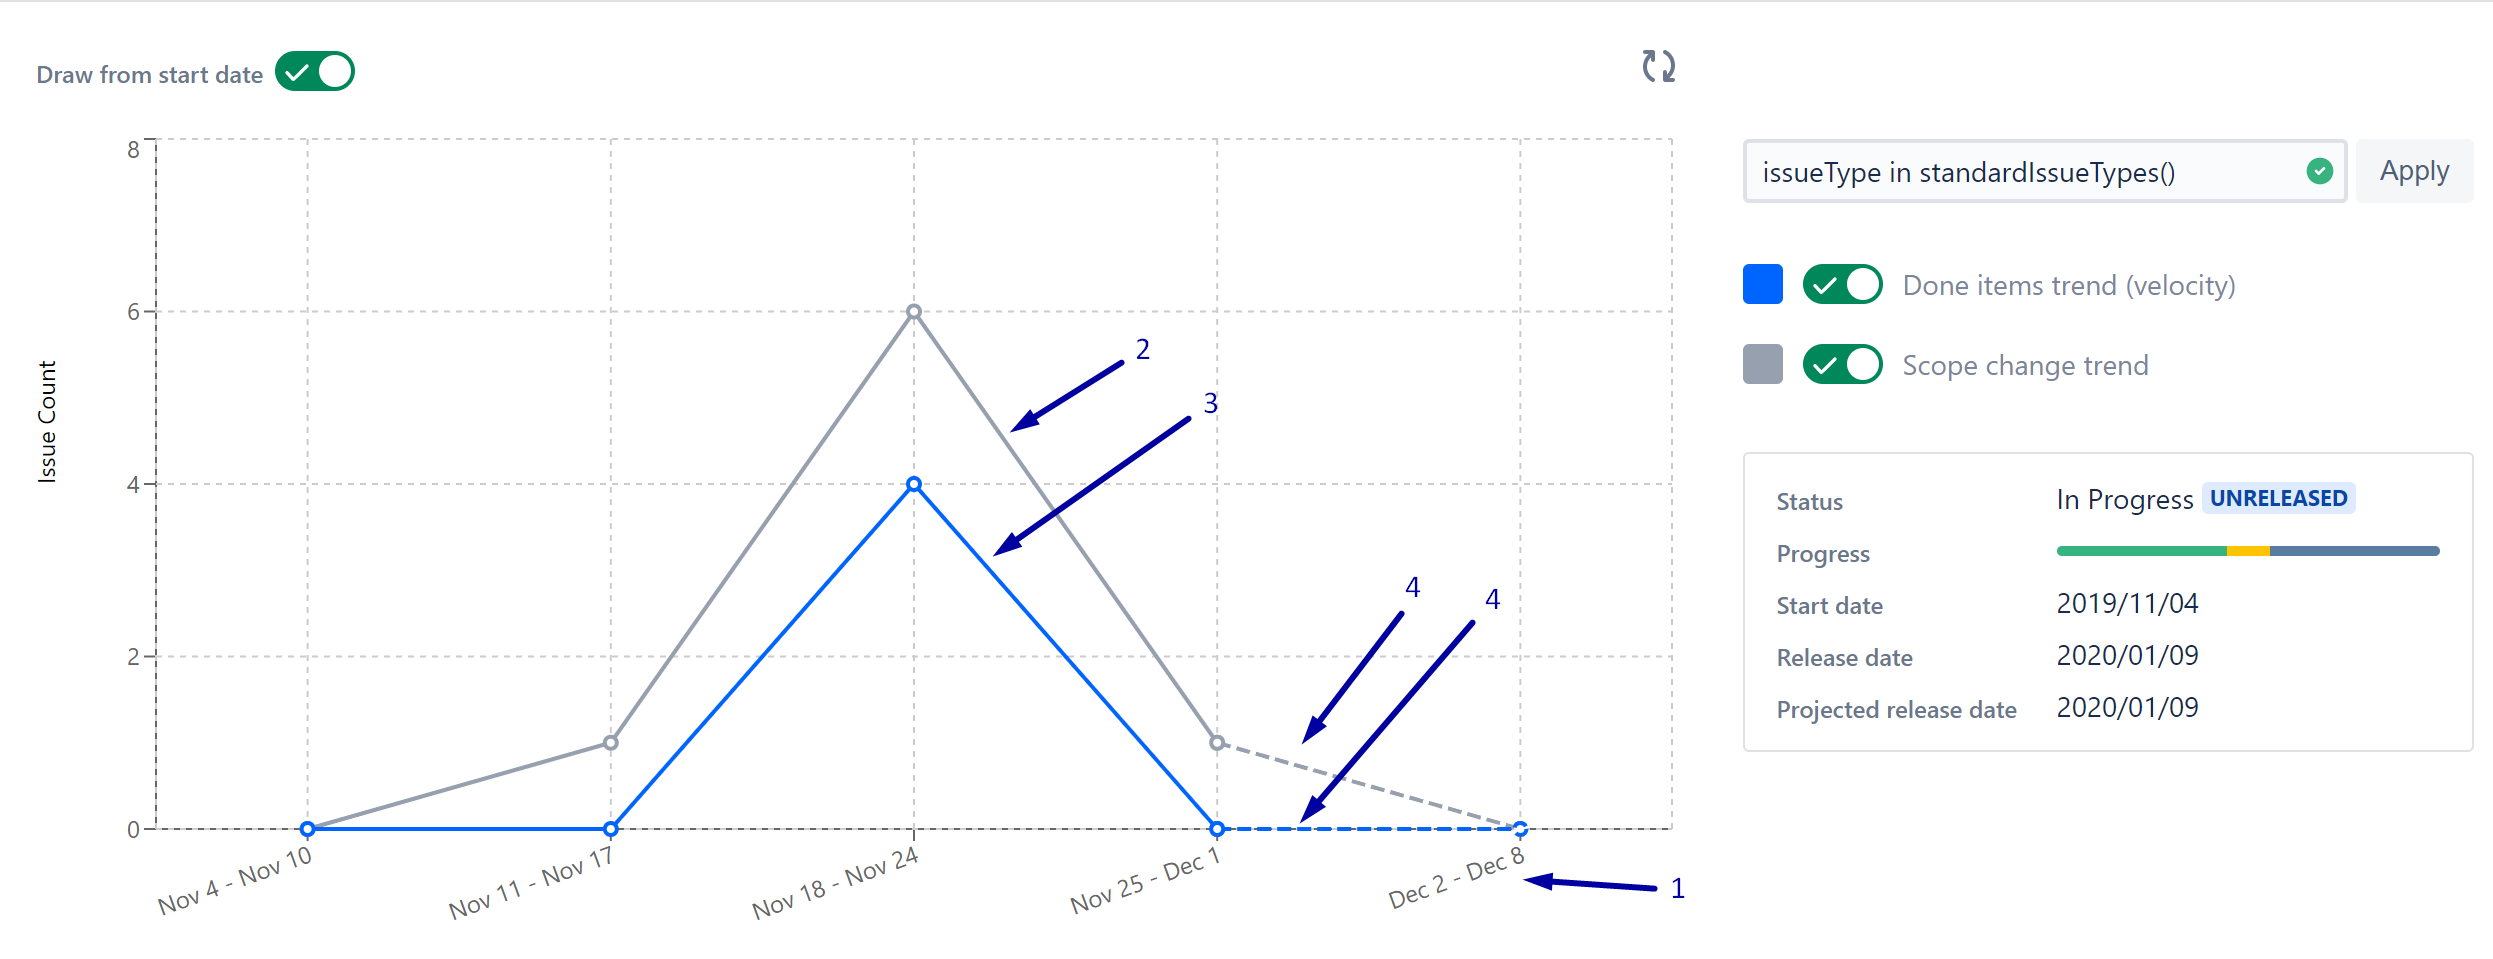
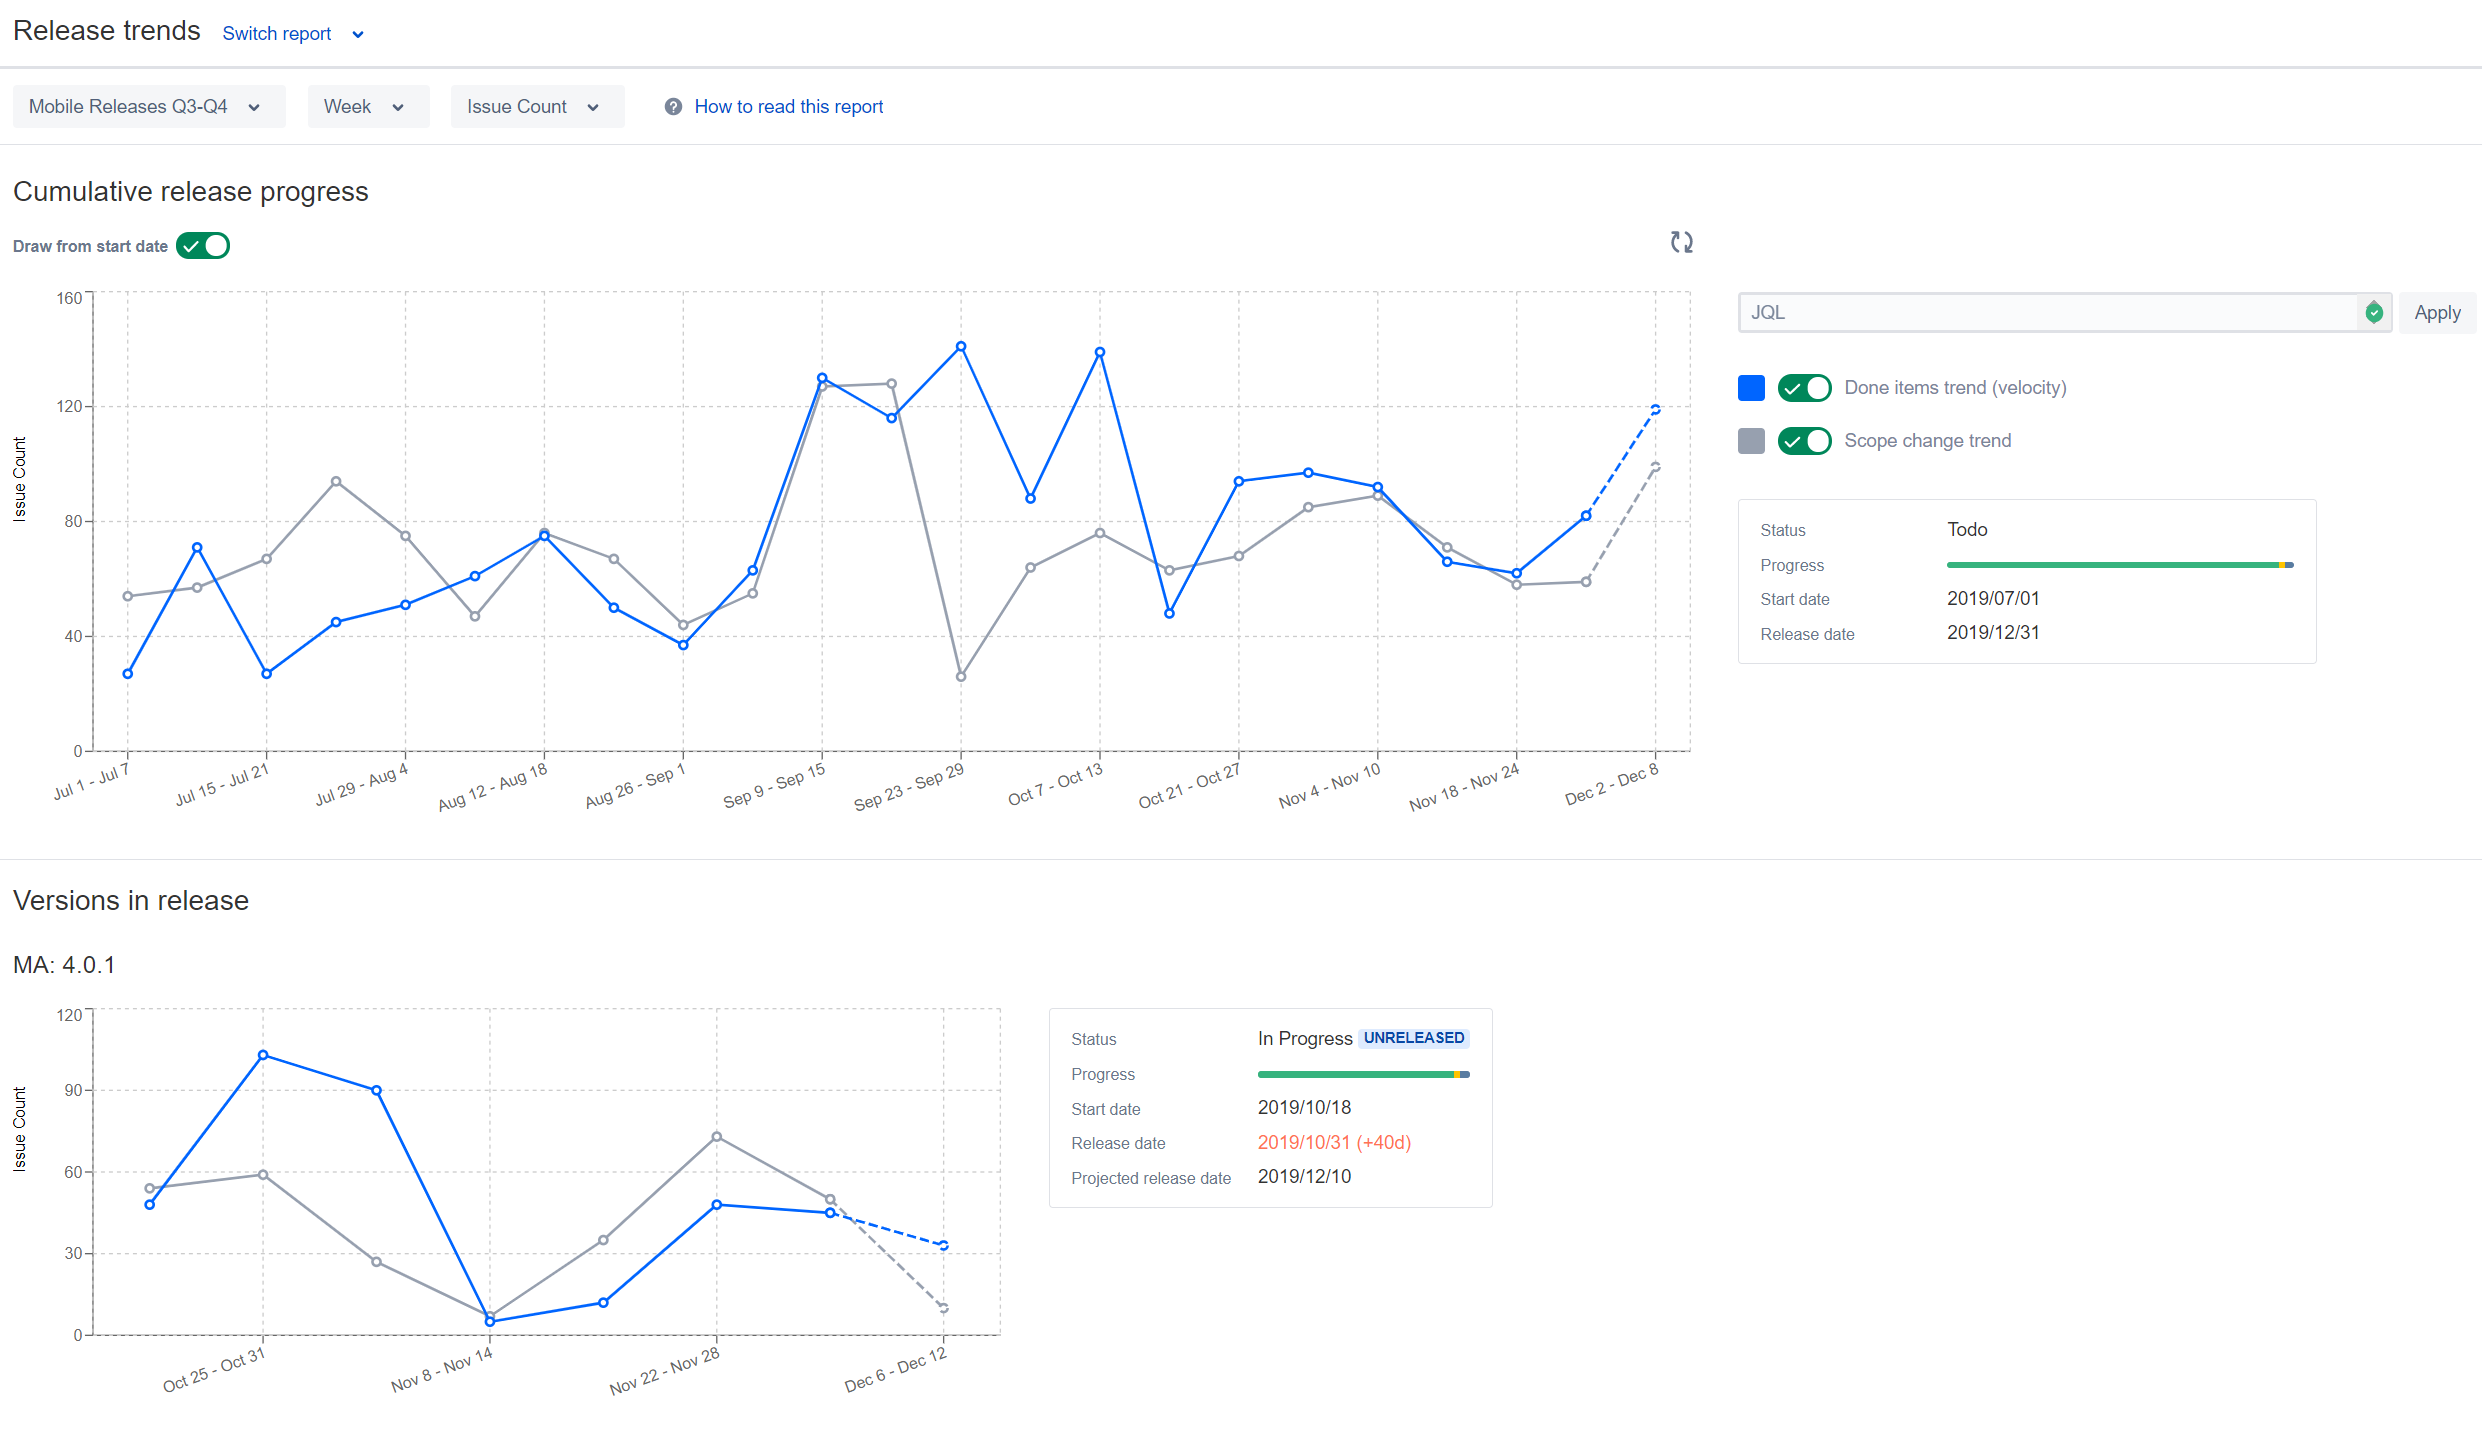
This report helps to outline scope change and velocity trends of the version.
Report configuration
Following configuration parameters are available:
...
| Info | |||||||||||||||
|---|---|---|---|---|---|---|---|---|---|---|---|---|---|---|---|
Few popular Use Cases:
|
Report content
The report has the following content:
- Period of the data aggregation. Te values are calculated by the formula: <# of items in period>= <# of items at the end of the period> - <# of items at the start of the period> +1 day
- Scope change trend line.
- Velocity trend line.
- Scope change and velocity for the current period are outlined with a dotted line.
Reports for Releases
...
Release
...
- Cumulative trends for all version in the release.
- Separate trends for each version in the release.
...
Burnup Chart
Release burnup chart is similar version burnup. It consists of two main parts:
- Cumulative scope. The chart shows the cumulative scope and progress for all the versions in the release on a daily base
- Separate charts for each version on the release.
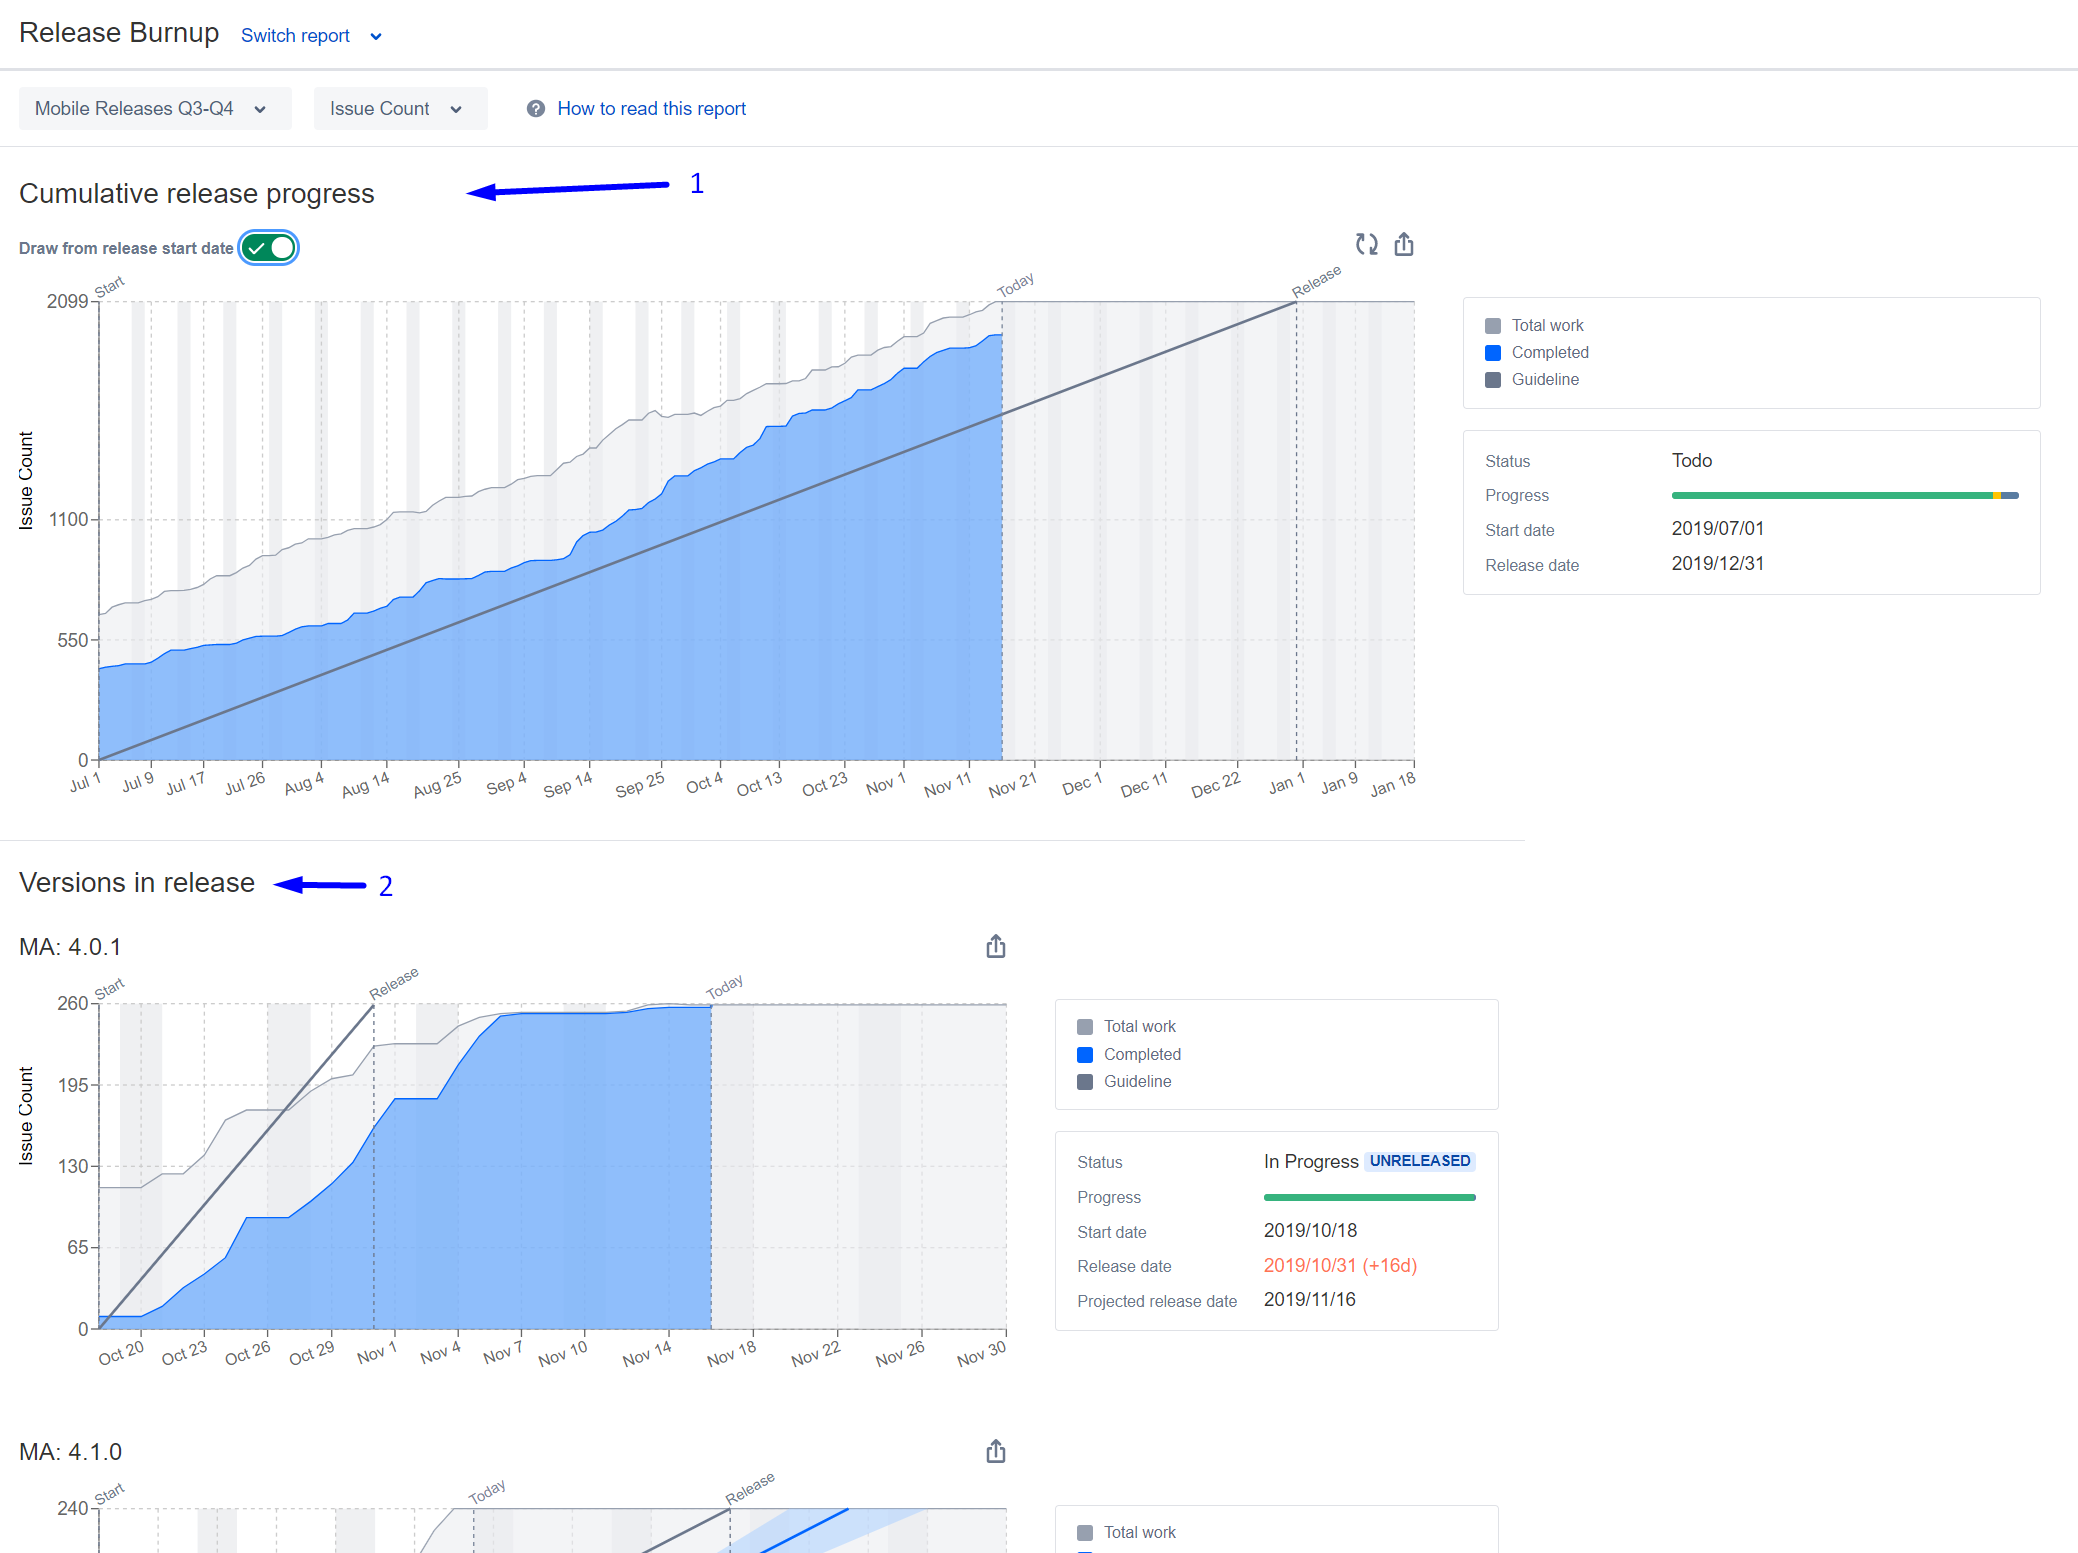
Report logic is similar to versions burnup.
Release Trends Report
| Info | ||
|---|---|---|
| ||
Will only take Fix Versions of specified release in account. For Virtual Versions we can't yet track history. |
Release trends report is similar version trends report. It consists of two main parts:
- Cumulative trends for all version in the release.
- Separate trends for each version in the release.
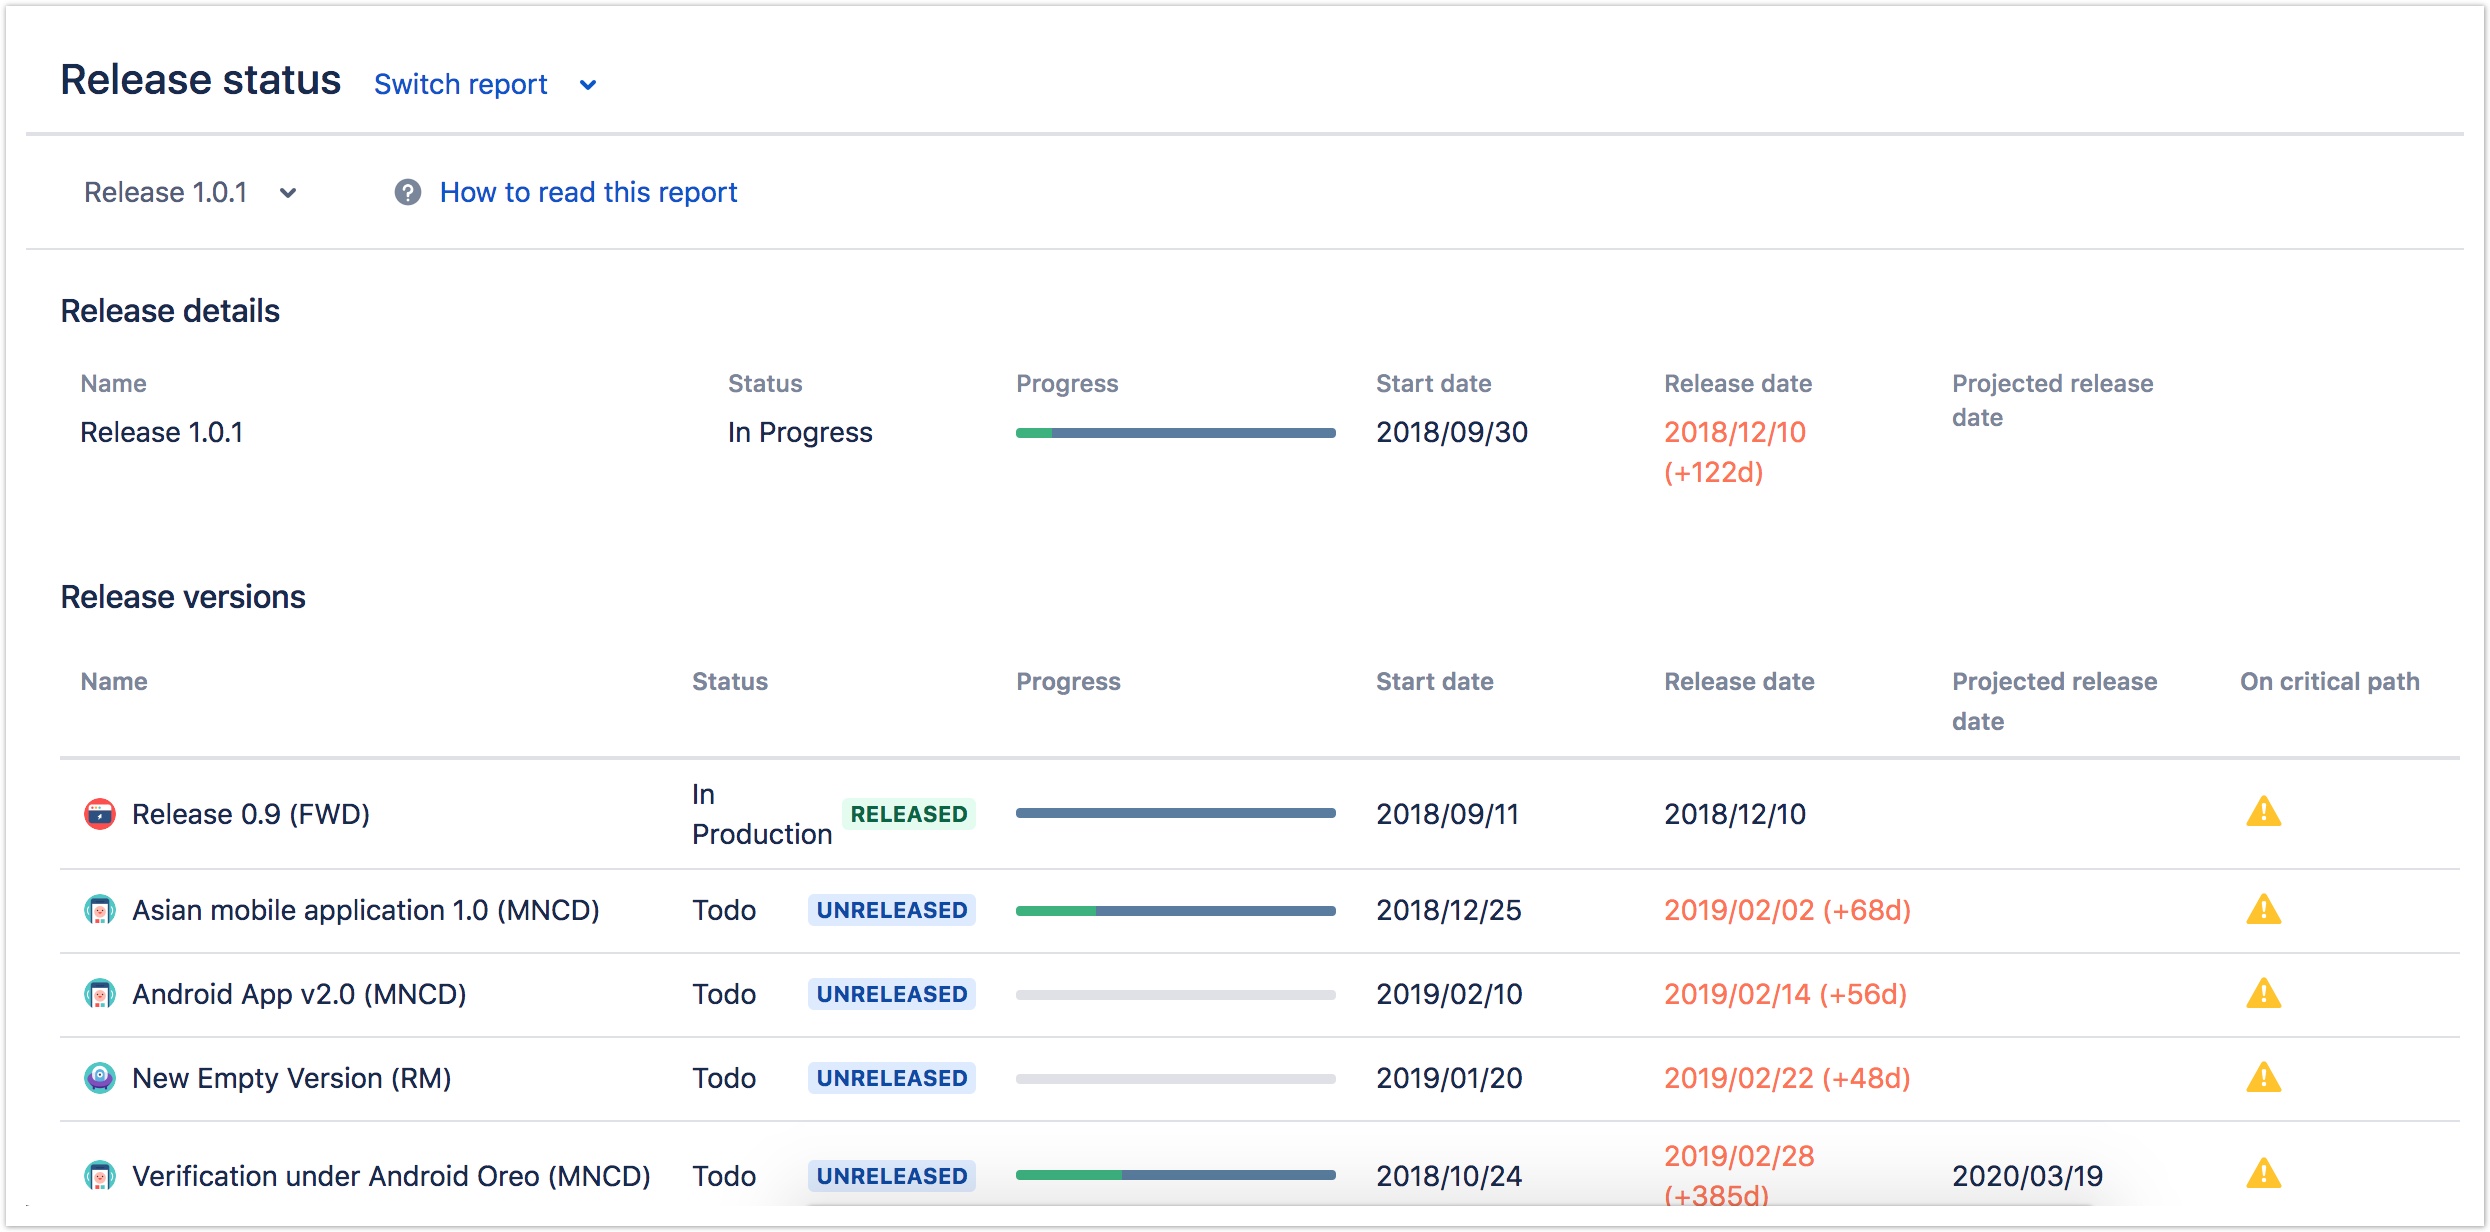
Release Status Report
Release status report helps users to understand the status of the release and all its versions.
...
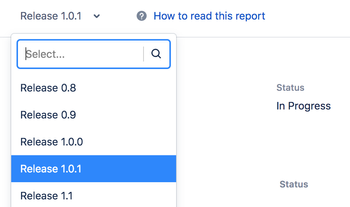
User can select any release available in the Release Board using the Releases selector:
Release Milestones Reports (Coming Mar'21)
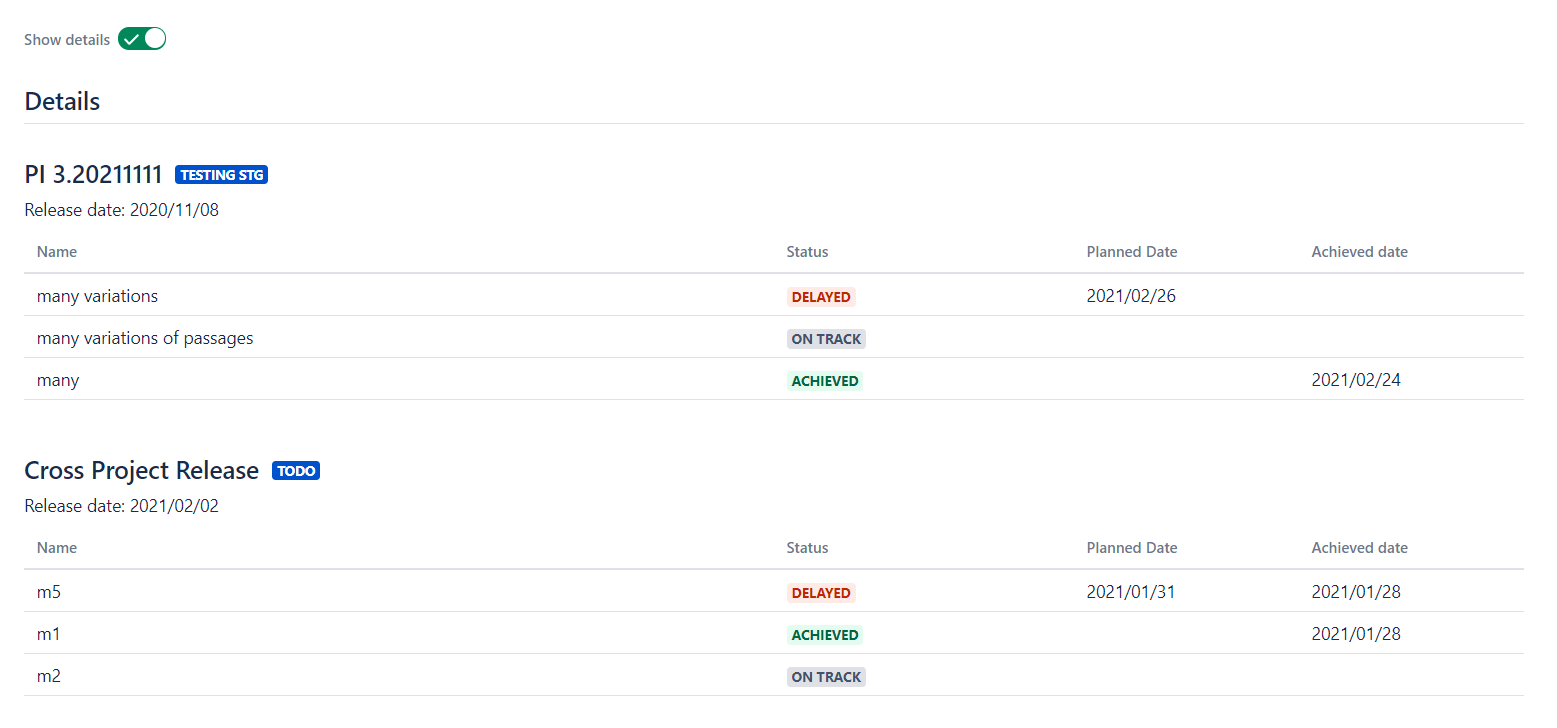
Release milestone report gives you an aggregated view on all milestones of cross-project release and its associated versions.
To open the report choose "Milestones" in release section of "Switch report" drop down.
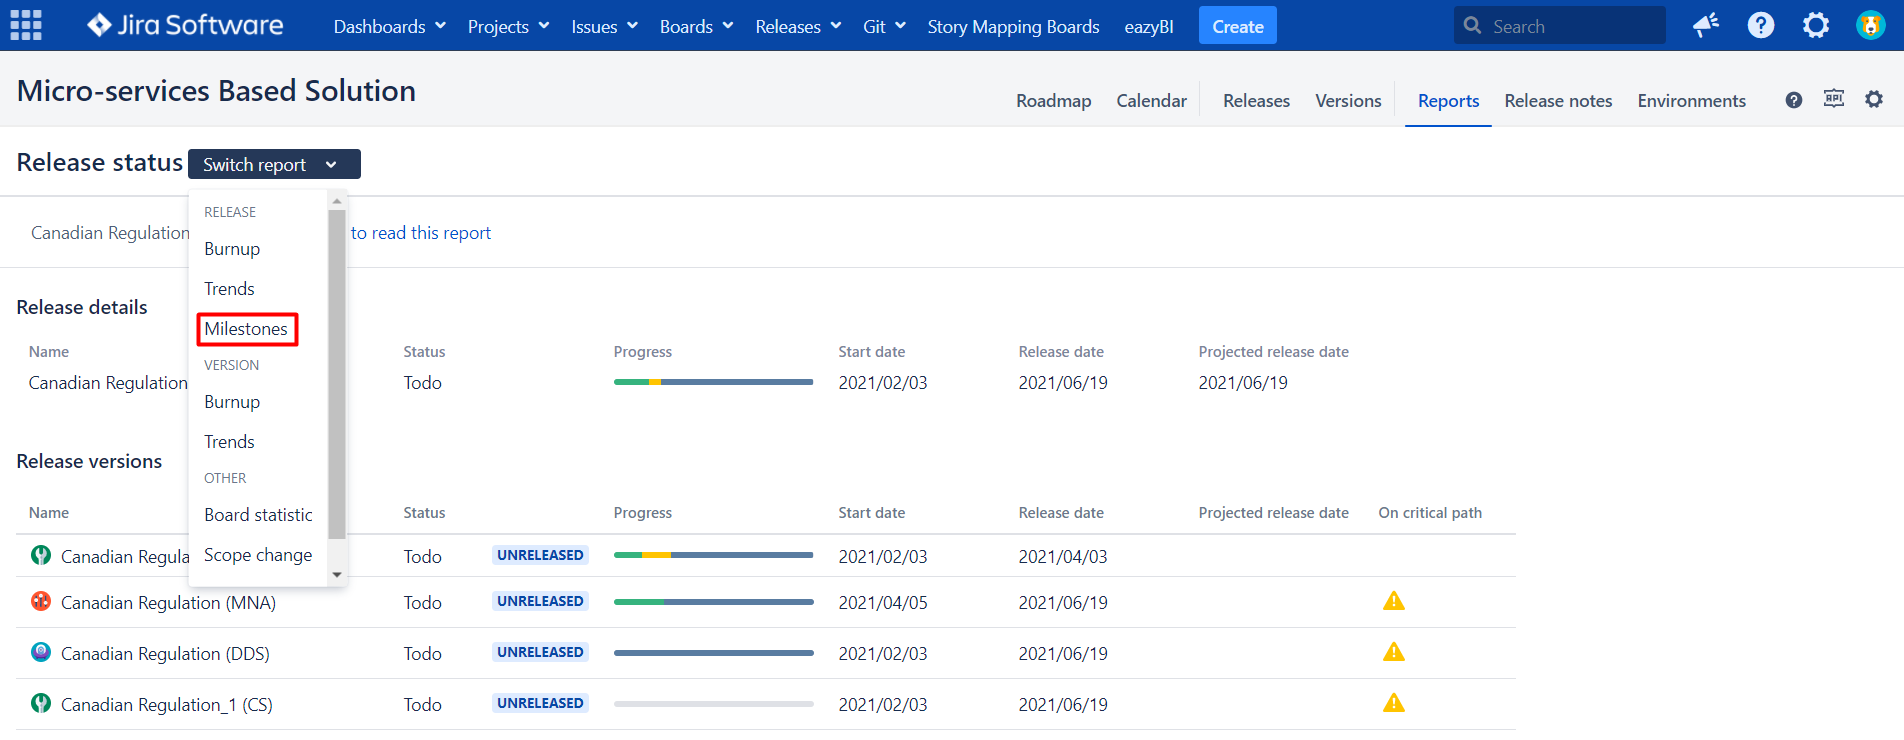
Choose one of your cross-project releases to generate the report.
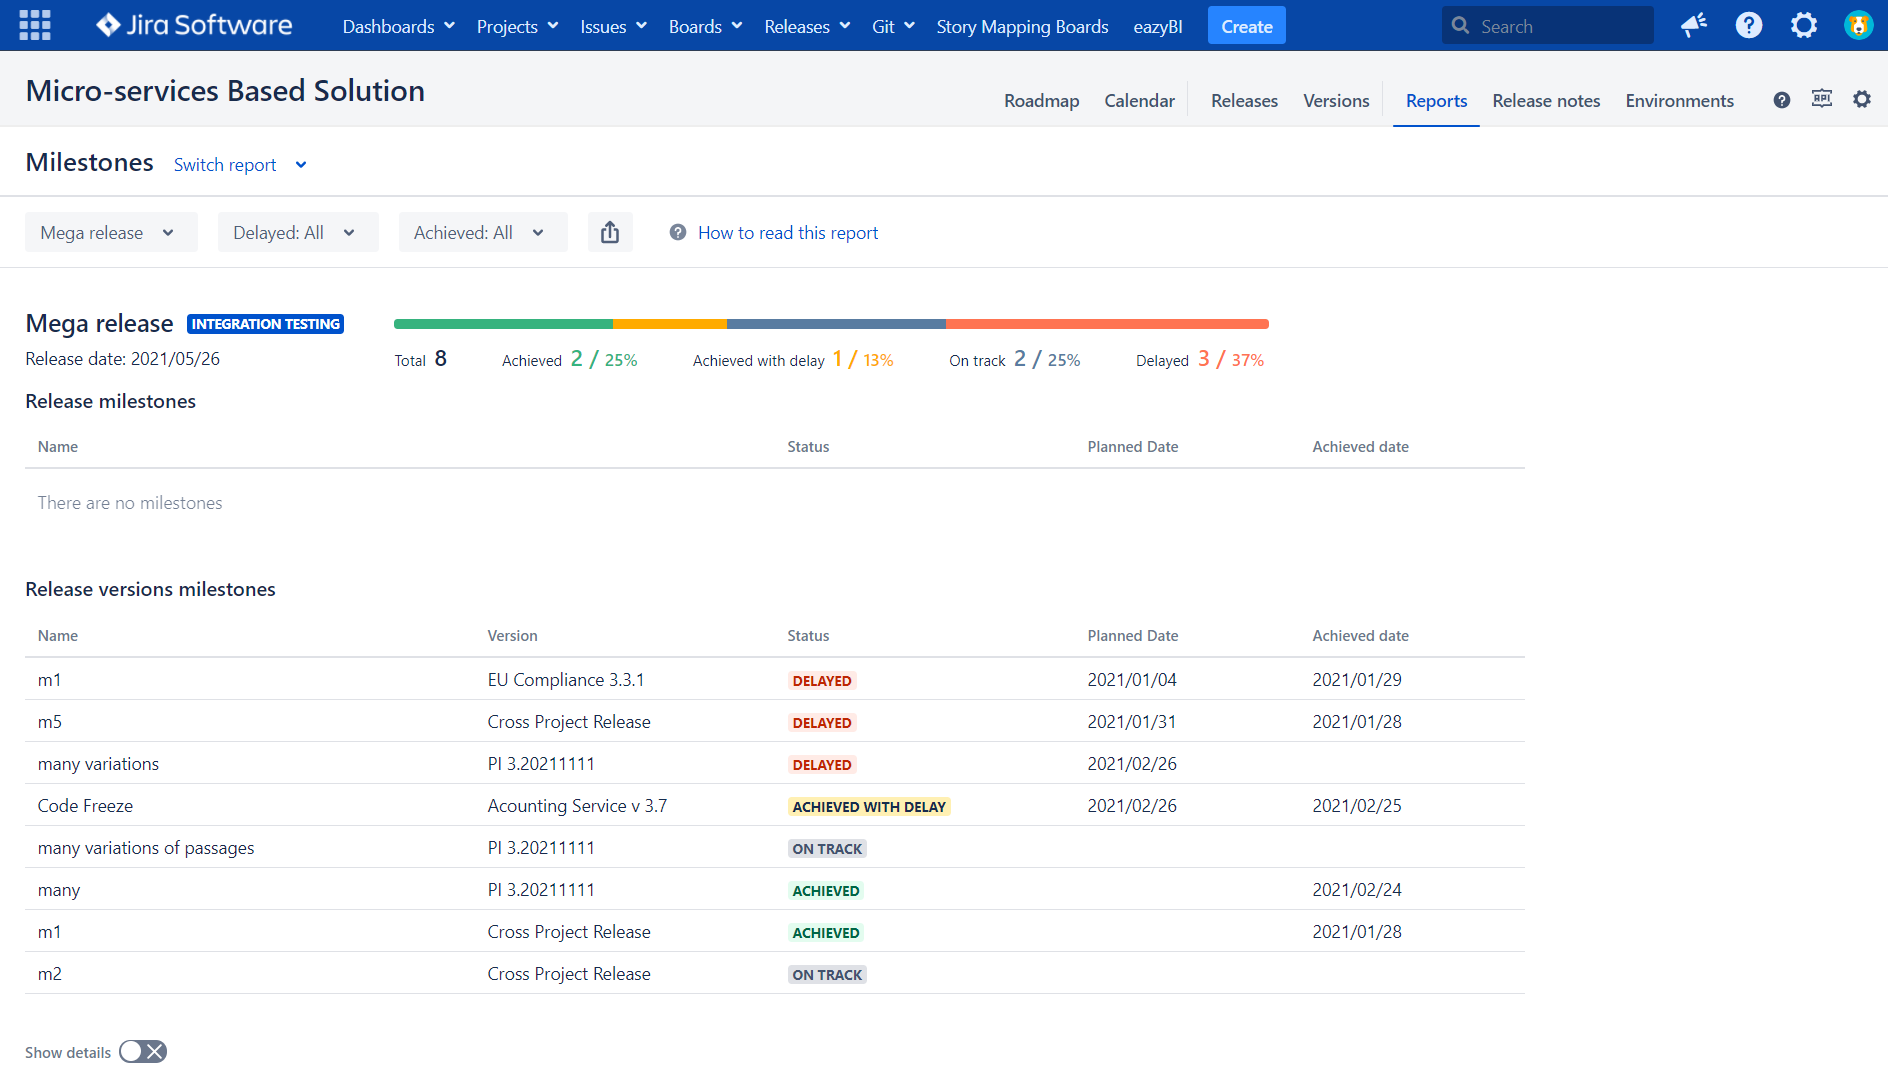
How to read track bar?
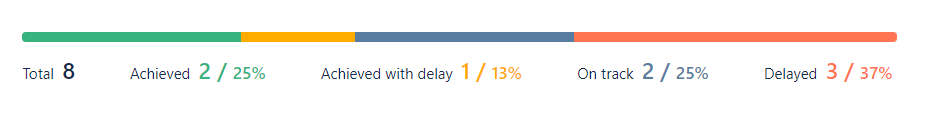
- Achieved states for milestones achieved at a date <= planned date
- Achieved with delay states for milestones ticked as achieved at a date > planned date
- On track means not yet achieved, but the planned date is in future (or empty)
- Delayed means not yet achieved with planned date in the past
Adjustments and configuration
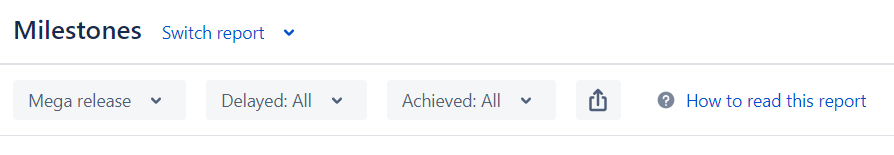
You can adjust the output by configuring some predefined filters:
- Delayed will shortlist only delayed milestones, not delayed or ALL
- Achieved will shortlist only achieved milestones, not achieved or ALL
- By clicking on "Export to CSV" you can download the output
If you want to go into further details and see version specific milestones toggle "Show details" at the bottom of the report.
Other Reports
Scope Change Report
...
Other Reports
Scope Change Report
| Info | ||
|---|---|---|
| ||
Only applicable for Fix Versions as we can't yet track history for Virtual Versions. |
Scope change report helps users to identify the issues that caused affect on the scope of a version or release.
...
The total number of issues in each section is displayed together with the Sum of Story Points and Time Tracking fields.
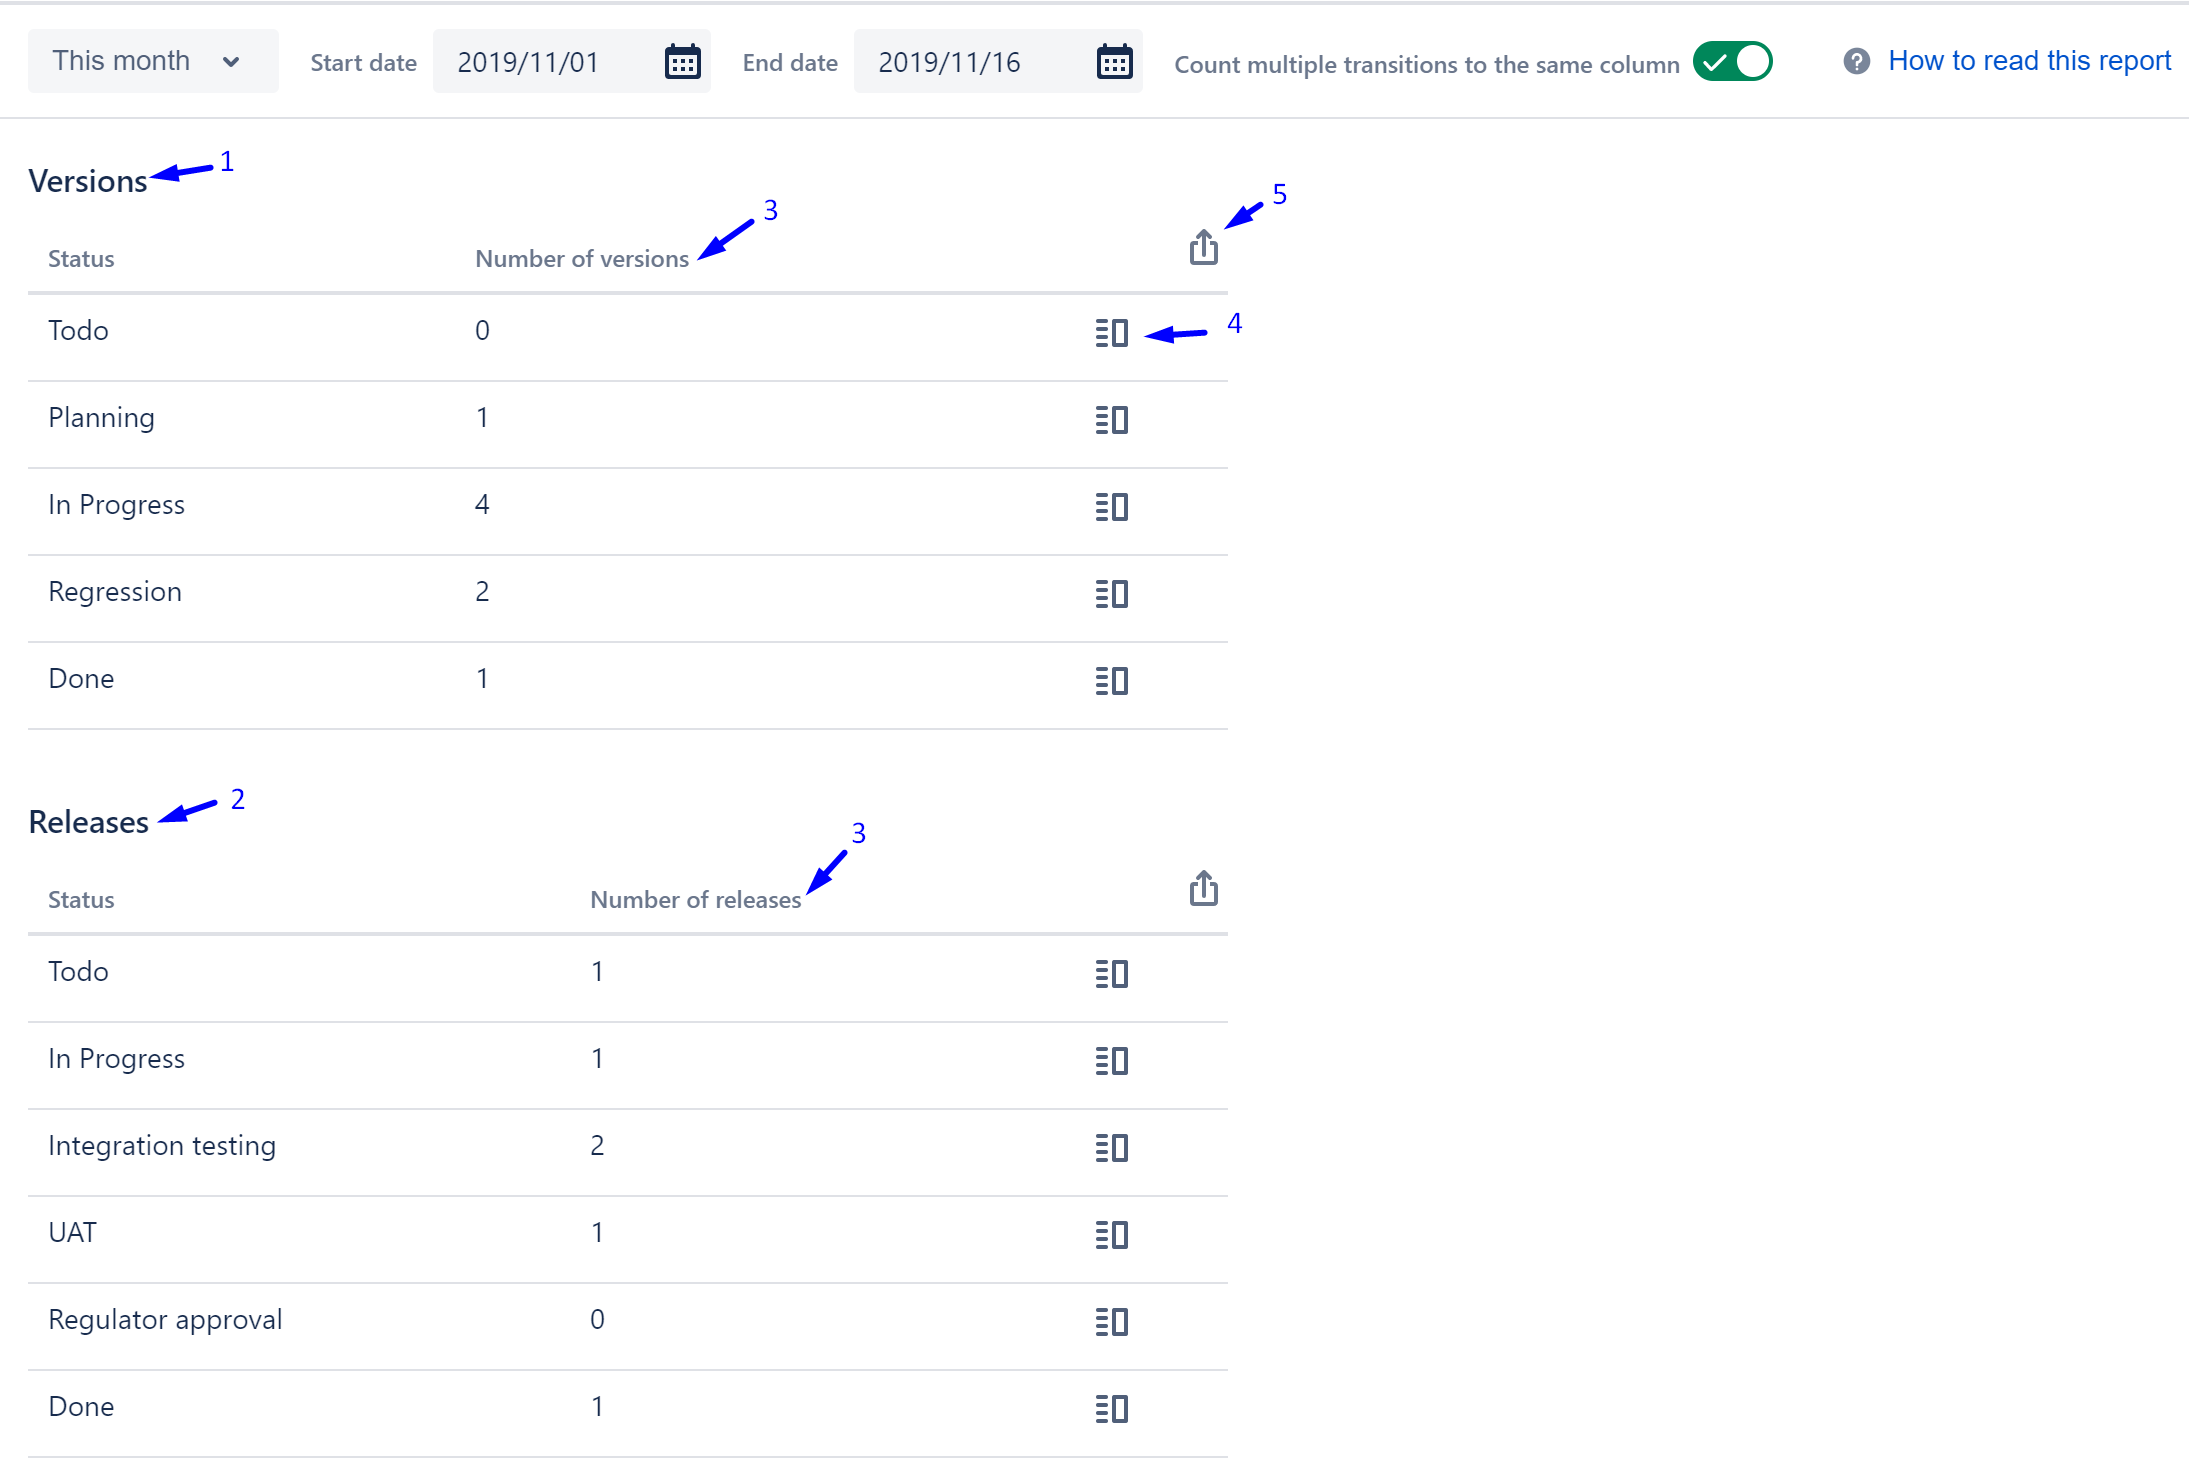
Board Statistics
The report shows the number of transitions into each column for version and release.
| Info |
|---|
Transition statistics for release will be calculated since version 3.3.0 of the Release management app will be installed. |
Reports configuration
User is able to define the following configuration parameters:
- Period. Defines a period for which the statistic will be generated.
Report content
- Statistics for all versions in the board
- Statistics for all releases in the board
- Number of versions or releases which were moved to a particular status during the selected period
Transition detail button. It opens a pop-up with all transitions to the selected status.
Info Transition details button is only available if
Export to CSV
Milestones Reports
Milestone report gives you an aggregated view on all milestones of cross-project release and its associated versions.
To open the report choose "Milestones" in release section of "Switch report" drop down.
Choose one or several of your cross-project releases and/or versions to generate the report.
How to read track bar?
- Achieved states for milestones achieved at a date <= planned date
- Achieved with delay states for milestones ticked as achieved at a date > planned date
- On track means not yet achieved, but the planned date is in future (or empty)
- Delayed means not yet achieved with planned date in the past
Adjustments and configuration
You can adjust the output by configuring some predefined filters:
- Delayed will shortlist only delayed milestones, not delayed or ALL
- Achieved will shortlist only achieved milestones, not achieved or ALL
- By clicking on "Export to CSV" you can download the output
If you want to go into further details and see version specific milestones toggle "Show details" at the bottom of the report.
More "Reports"?
In the "More reports" section we compiled the list of reports that we want your feedback and votes for.
...
| Report | Description |
|---|---|
| Release & Version Burndown | Track the total work remaining and project real release date. This helps you to manage release or version progress and respond accordingly. |
| Release Velocity Chart | Control your release velocity over time through each particular version velocity monitoring. Identify velocity degradation and potential delays upfront. |
Suggest your report
We are open to your feedback! If you have an idea or need any other report, please let us know using the simple feedback form:
...